XAFS定制化技术指导
96.2%
好评率
部分论文致谢
项目简介
定制化指导服务分为三个阶段: 数据分析+线上教学+加强指导。服务周期通常在2个月内。
审稿意见的回复:对于客户委托解答的审稿问题,我们可以提供专业的中英文双语解答,并直到文章接收。
{{moduleItem.modulename}}
结果展示
一、定制化技术指导:包含数据分析、线上教学和加强指导。服务周期通常在2个月内。服务过程如下:
1. 我们首先会根据客户的需求,为客户做数据分析,提供结果报告,客户先熟悉了解自己材料的分析结果。
2. 当客户了解自己的分析结果后,约定线上教学,为客户展示该分析结果是如何获得的整个过程。
3. 该过程会录制视频并提供给客户,客户通过视频进行再学习,用自己的数据反复练习直到可自行分析。
4. 对于学习过程中的疑问,可以记录整理到word文档中,并在与我们约定时间,进行后期的加强技术指导。
案例:作者研究方向是电催化,做单原子催化剂,预期是Fe-N4结构。已有测试数据,想先分析,并学会数据处理和写文章。
A、 确定数据分析内容 —— 例如,做2D标配全套的分析(5月8日客户自行选择了分析内容)
1. 根据数据实际情况,为客户进行基础标配数据分析,并提供数据结果报告。
2. 客户收到报告,详细阅读理解,如有疑问,可在教学时提出;
3. 与项目经理确定需要学习的具体内容和学习时间。
B、数据处理的教学(客户约定时间5月25日线上教学,收到数据报告的一个月内)
1. EKR空间(Athena软件): 数据导入、前期处理、归一化、矫正、结果导出、作图。
2. 结构拟合(Artemis软件):CIF获取,参数的设立,标样(单质和氧化物 )、样品拟合全过程讲解、结果导出、作图。
3. 小波变换(Hama-Fortran):演示拟合过程和小波作图(2D作图)。
4. 拟合质量的判断讲解:主要拟合参数的合理范围和文章写作规范。
5. 如需进行LCF拟合、路径图分析以及一阶导数拟合,进行指导前说明即可。根据客户的情况针对性的简述或详细。
C、 后期的加强指导(客户约定7月5日进行加强指导,收到数据报告的两个月内)
1. 针对客户对拟合教学过程有不清楚的进行答疑讲解,直到清楚明白。
2. 针对作者自己处理数据遇见的问题如何解决,进行交流讲解,直到清楚明白。
3. 针对如何用数据写文章(限电催化领域),进行针对性指导建议。如需进行帮忙写作,则另外付费。
二、 审稿意见回复说明:对于客户委托解答的审稿问题,我们提供专业的英文回复,有的问题会为客户进行进一步的数据分析。审稿意见提交后,如果审稿人就此再提出相关XAFS的问题,我们会负责完成回复并直到文章接收。
Questions 1: the authors state that the redox state of the MSAs is between 0 and 2. The edge energy for MSAs appears to be above that for MO and closely match that for MPc, which suggests that the M centers are nominally M(II). To make this point clearer, a plot of the XANES that zooms in on the rising edge in the XANES should be included, perhaps with a plot of the first derivative of the XANES to show how the edge inflection points compare between samples. These figures can go in the SI.
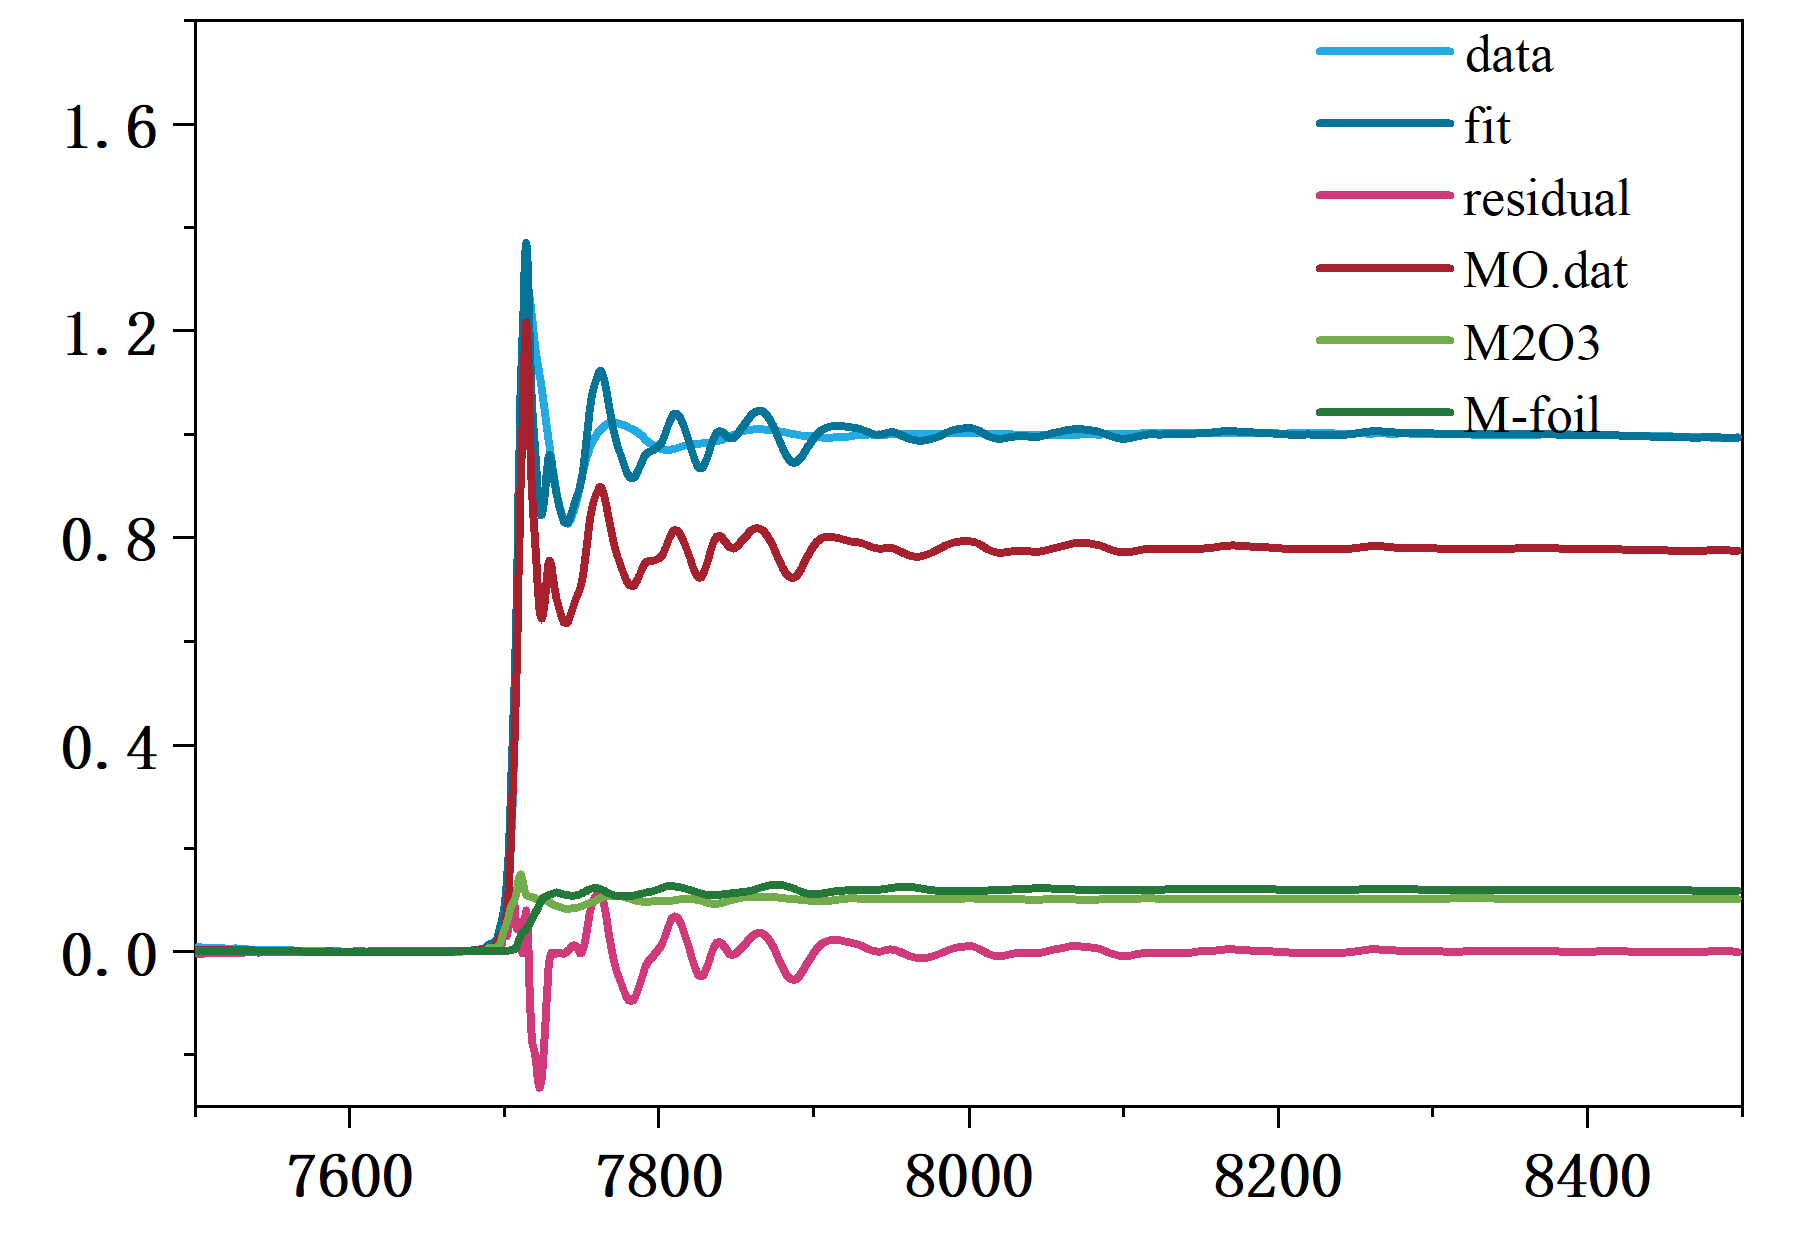
Response: We express our gratitude to the reviewer for providing constructive comments to improve the logistical aspects of this study. To comprehensively investigate the coordination environment of the cobalt (M) sample, a linear combination fitting was also conducted utilizing various cobalt standards. Analysis of the fitting results revealed that MO displayed the highest ratio, measured at 0.779 ± 0.035, among MO, M foil, and M2O3. In contrast, the ratios for Co foil and M2O3 were only approximately 0.1. This observation indicates that the coordination environment and oxidation state of the M sample closely resemble those of MO in a +2 oxidation state. The graph of the LCF result have shown in Figure X.

Questions 2: Taking this synchrotron radiation as an example, what are the fitting models for the author's several materials Ru-Mo2C/C(I), Ru-Mo2C/C(II), RuMoC/C(I), and RuMoC/C(II)? In other words, based on what rules were they fitted? I would like to understand this information, thank you. Is there any relationship between σ2 and ΔE0 during the fitting process?
Response :The structural paths chosen for fitting are selected based on the structural indications presented by the spectrum. Taking RuMo2C as an example, there is a distinct peak between 1 and 2 Å, indicating the presence of Ru-O bonds. Therefore, for the 1–2 Å range, the Ru-O path from RuO2 is selected for the fitting process (other ruthenium oxides could also be used, but this is not fixed). For the second-shell structure, the peak positions correspond closely to those of Ru foil, suggesting that this structure aligns with Ru-Ru bonds in Ru foil. If Ru-Mo bonds exist, based on the peak positions, they are likely to be in the form of an alloy or cluster. Hence, the fitting paths for the 2–3 Å range are derived from Ru foil and RuMo2C (other RuMo alloys could also be considered, but this is not fixed) {Adv. Funct. Mater. 2022, 32, 2108345}. The above outlines the specific structural models selected for fitting and the reasons for their selection. To the best of our knowledge, there is no pronounced correlation between σ2 and ΔE0. According to the fitting function x(k), it is clear that F(k) serves as the amplitude term, which is correlated with the coordination number N and the degree of disorder σ2. These two parameters exhibit a marked correlation, indicating that as σ2 increases, N also increases{ACS Appl. Mater. Interfaces 2022, 14, 29822−29831}. As for the ΔE0 value, it represents the displacement of energy sites, typically exerting a more significant influence on the low-K region and a lesser effect on the high-K region. The low-K region predominantly affects the structural information at low R values.
常见问题

1. 审稿意见回复的内容和保证有哪些?
对于客户委托解答的审稿问题,我们提供专业的中英文双语解答,并直到文章接收。(如果审稿意见的答复需要进行数据分析,我们也会进行数据分析。)

2. 定制化指导的服务内容、过程和目的是怎么样的?
定制化指导分为三个阶段: 数据分析+线上教学+加强指导。服务周期通常在2个月内。
- 我们首先会根据客户的需求,为客户做数据分析,提供结果报告,客户先熟悉了解自己材料的分析结果情况。
- 当客户了解自己的分析结果后,通过线上教学,为客户展示该结果是如何分析得到的整个过程。
- 该过程会录制并给到客户,客户可以跟着视频私下进行反复学习练习,这样针对自己的数据进行加强学习。
- 在学习的过程中的疑问,可以一一记录整理到word文档中,并在与我们约定时间,进行一次后期的加强指导。


 您已经拒绝加入团体


 可享受最低
可享受最低 元的信用额度,先测后付0元下单

 元无门槛现金免单券
 积分加速得,千万好礼等你兑


