


 您已经拒绝加入团体

 2024-09-10
 5429
5429
 0
0
【摘要】 Electrochemical Impedance Spectroscopy (EIS) is a technique in which the impedance of an electrochemical system is measured over a range of alternating current (AC) signals with varying frequencies.

Introduction to Electrochemical Impedance Spectroscopy (EIS)
EIS is a popular, powerful measurement method that can be used for anything from routine testing to cutting edge R&D of next-generation electrochemical systems
Electrochemical Impedance Spectroscopy (EIS) is a technique in which the impedance of an electrochemical system is measured over a range of alternating current (AC) signals with varying frequencies. Impedance is defined as the effective resistance of an electric circuit or component to alternating current, arising from the combined effects of ohmic resistance and reactance.
When used properly, EIS is a non-invasive technique that reveals a wealth of electrochemical information about any system under test. Compared to DC methods that are mostly suited for highly conductive systems, EIS can be applied to systems with very high to very low conductivity – notably batteries.
EIS is like any other spectroscopic technique, for example visible light spectroscopy, which is how we recognize the color of an object. In visible light spectroscopy, light waves in the visible frequency range (430-770 THz) hit an object. Some of the light waves will be absorbed by the object, and the rest of it will be reflected or transmitted. Our eyes sense the reflected light and our brain analyzes the spectrum of light waves. Thus,we can tell the color of the object.
EIS is analogous to light spectroscopy, but uses voltage or current waves instead of light waves. The voltage or current waves are applied between the electrodes of the electrochemical system being measured. Since the amplitude of the voltage and current waves are small, they do not introduce significant changes to the system under test. The device under test responds with a current wave if a voltage wave is applied, and vice versa. However, this output signal will have a different amplitude compared to the input signal, and it will be “phase shifted.” This means the wave peaks will either lag or lead the peaks of the input signal.
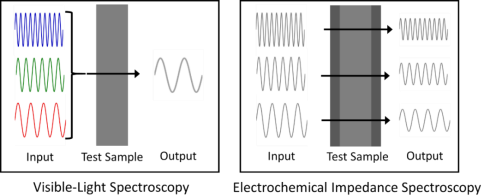
Figure 1. Analogy between visible-light spectroscopy and electrochemical impedance spectroscopy. In both methods, waves of various frequencies are applied to a test sample and the outputs are recorded. By analyzing the output with respect to the input, the properties of the system can be studied.
Analyzing these differences in amplitude and phase reveals information about the composition and functional properties of the electrochemical system being studied. If a wide range of frequencies are applied that can interrogate every electrochemical phenomenon, the electrochemical device/system can be completely characterized if correct data analysis methods are utilized.
How Does One Configure an EIS Experiment using a Potentiostat?
When performing EIS, the input signal can be a voltage wave or current wave. In “Potentiostatic EIS,” a series of voltage sine waves are generated, and these waves can be centered at 0 V or some other constant voltage setpoint. Anytime a non-zero voltage setpoint is used, this is called applying a “DC Bias or Offset.”
Each wave in the series has the same voltage amplitude which is set by the user. Typically, a user sets the voltage magnitude somewhere between 1 and 50 mV, but this varies depending on the type of experiment or sample being studied. However, each sine wave in the series is configured to have a different frequency.
Each sine wave is applied to the sample one-by-one in an either ascending or descending order of frequencies. The high and low frequencies that are applied are chosen by the user based on what frequency range they expect their sample to respond to in a measurable way. “Galvanostatic EIS” is very similar to “Potentiostatic EIS” except that there are current waves being used as the input instead of voltage waves.
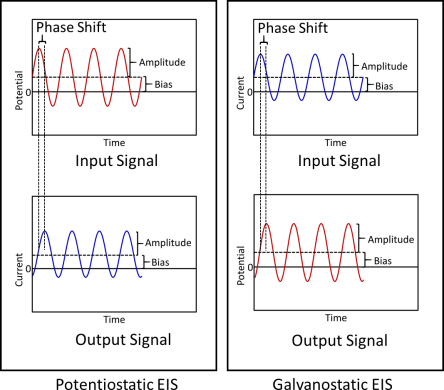
Figure 2. Difference between Potentiostatic and Galvanostatic EIS methods. In Potentiostatic EIS, the input signals are the voltage sine waves and the output response signals are the current sine waves with a different amplitude and phase but of the same frequencies. In Galvanostatic EIS, the input signals are current sine waves and the output response signals are voltage waves.
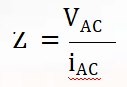
After deciding on the type of wave and range of frequencies to scan through with your potentiostat, the potentiostat applies the AC input signals and records the resulting AC output signal for internal processing. What is the resulting data that is generated from these input signals? In Potentiostatic EIS, the output signal being measured is the series of current sine waves that share the same frequency of their corresponding voltage input signal but with a change in amplitude and phase – and vice versa for Galvanostatic EIS. The ratio of voltage (VAC) to current (iAC) waves is known as impedance (Z).
The internal processing that goes on inside the potentiostat calculates the following: Frequency, Impedance Modulus (real & i), Phase, DC Current, and DC Voltage. The concept of impedance is like resistance in that they are the ratio of voltage to current. But, impedance is a more all-encompassing concept compared to resistance because resistance can only define the property of resistors only. This is because in a resistor, a single frequency can completely describe its behavior since the voltage and current response are in phase at all frequencies.
However, the AC nature of impedance means it has both magnitude and phase. Therefore, impedance can define the behavior of many more devices (like capacitors and inductors) which have non-linear voltage and current relations. For example, at low frequencies,a capacitor shows its usual DC behavior where current leads voltage by a 90 ° phase angle. But at higher frequencies, it shows a resistive behavior where current and voltage are in phase and there is a 0° phase angle. The different behaviors at different phase angles demonstrates that a single frequency cannot completely describe the electrochemical response of a capacitor. So, impedance can be thought of as frequency-dependent resistance.
The ability to chart how impedance values change as a function of frequency and phase is what makes EIS so useful. In a typical EIS spectrum, the modulus of impedance and phase are plotted against frequency in what is commonly referred to as a Bode plot. Bode plots are useful because one can easily see the frequency response of the electrochemical device under test. But, the main drawback of a Bode plot is that the graph does not offer an intuitive way to analyze the impedance behavior of the system being tested.
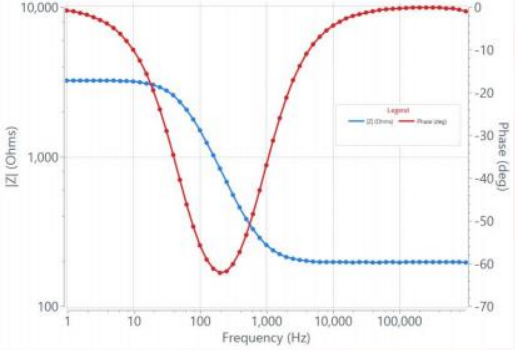
Figure 3. Screenshot of an example Bode plot of a real R(RC) circuit using a Squidstat Plus potentiostat
Because waveforms can be represented a using a complex plane approach (meaning graphing the real vs. imaginary part of the waveform data), a more visually appealing and often more informative way to represent EIS data is to plot the imaginary part of the impedance (Z") against the real part of the impedance (Z'). In this way, two Bode plots are represented by a single plot, but the frequency parameter is hidden. This graphical format is called a Nyquist plot and is arguably a more popular way to graph EIS data because it has a more intuitive feel and many features of the sample under test can be assessed just by visual analysis.
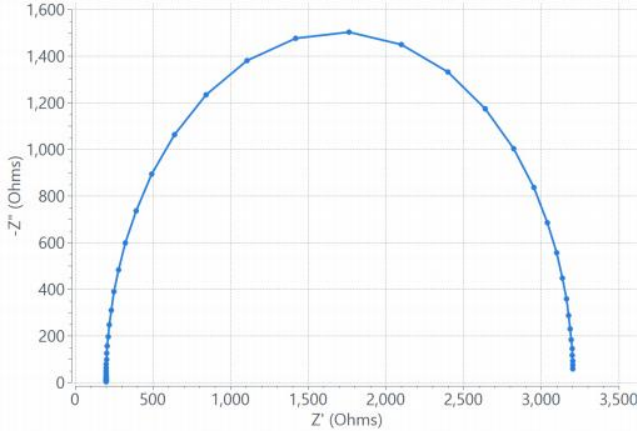
Figure 4. Screenshot of a real Nyquist plot of a R(RC) circuit obtained from aSquidstat Plus entiostat.
Using Equivalent Circuit Models for EIS Data Analysis
Analyzing EIS data is easier said than done and can be prone to error without the appropriate training to create accurate data models. Besides visually inspecting at a Bode or Nyquist plot, there is no straightforward way to analyze EIS data without also using advanced modeling concepts. This is because an electrochemical system is complex and consists of many different elements interacting with each other. Such interactions can vary based on time, temperature, pressure, voltage, current, and many other variables that may be dependent or independent of each other. Modeling EIS data using the methods introduced below can fully represent the properties of the system and accurately predict how the system will react to simulated inputs.
EIS models can be created using an analytical approach starting with basic equations for kinetic, thermodynamic, and mass-transfer phenomena. Using this approach, even the microscopic properties of the electrochemical system can be revealed. Although this method is very powerful, it requires a very high level of expertise to carryout accurately. A much more common approach is to create Equivalent Circuit Models (ECMs) starting with basic circuit elements such as a resistor, a capacitor, or an inductor that have distinct responses to voltage and current waves. For example, a very simple ECM of any electrochemical system can be constructed with a resistor representing the electrolyte (Rs) in series with the capacitors representing the electrode/electrolyte interfaces at the cathode (CD, Cathode) and the anode (CD, Anode). To account for the faradaic charge-transfer reactions happening at the electrolyte/electrode interfaces, resistors representing charge transfer resistance at the cathode (Rp, Cathode) and the anode (Rp, anode) can be added in parallel to their respective capacitors. The simulated Nyquist plot for this model is shown below.
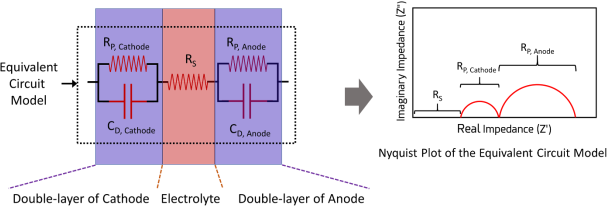
Figure 5. An equivalent circuit model representing the double-layer of a cathode, electrolyte and the double layer of an anode. The right-side is the Nyquist plot corresponding to the equivalent circuit model.
The Rs can be obtained from the first intercept of the x-axis of the Nyquist plot. The second and third intercepts on the Nyquist plot can be assigned to Rp, Cathode and Rp, anode. The height of the first and second semi-circles correspond to the CD, Cathode and CD, Anode.
Please note that the EIS is not directional in nature, meaning that, in the above model, the assignment of the first semi-circle to the cathode and the second semi-circle to the anode is arbitrary. Anyone carrying out such an analysis needs some understanding of the system beforehand to correctly assign parts of the ECM to the elements of the electrochemical system. If one is just interested in measuring the electrolyte resistance, one need not even fit the EIS data with a model. One can just measure it be reading the value at the first x-intercept.
Example - Using EIS for Battery Testing
In the context of battery testing,a battery needs to have very low electrolyte and charge-transfer resistances. These parameters are easy to obtain by doing EIS on the battery and using an equivalent circuit model like described above. Thus, EIS is very useful as a standardized testing routine in an industrial setting when doing a consistency check between different battery cells. Since atypical EIS experiment from 100 kHz to 1 Hz requires just few minutes, running each battery through an EIS test after production is a reliable and time-saving way to ensure there are no defects introduced during assembly.
Then, one could go a step further and develop a more comprehensive equivalent circuit model representing a “normal” battery in production, and then check the model fit for every battery that undergoes EIS after production to test for performance, failure modes, and ways to boost performance in future designs. ECM software is available as part of the software package for most research-grade potentiostats.
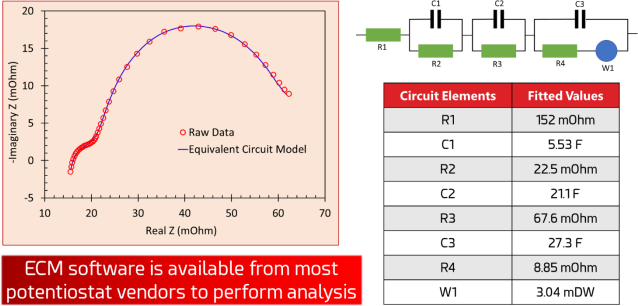
Figure 6. A Nyquist plot fitted to an equivalent circuit model with values automatically calculated by the potentiostat software. The values of each individual circuit element can be used to compare and contrast the characteristics of each battery that undergoes EIS testing.
Ultimately, EIS is so popular because it’s a powerful method that can be used for anything from checking Nyquist plots during routine quality assurance testing to cutting edge modeling of next-generation energy storage materials.
科学指南针商城,现已上架电化学工作站相关商品,欢迎选购:
美国Admiral艾德茂 电化学工作站
https://mall.shiyanjia.com/product-detail.html?product_id=2123729&category=2
东华DH7003B双通道电化学工作站
https://mall.shiyanjia.com/product-detail.html?product_id=1932130&category=2